Hi all,
One good thing which has happened while building our product is that we have gotten a huge amount of Instagram data to play with.
We were experimenting with a feature that would go through the images of Instagram handles and group visually similar images together into categories. The categories would then be ranked based on engagement to find what kind of images generate higher engagement and which ones generate lower.
I thought to share some interesting results with you so that I can get your inputs and feedback on how this looks to you. If this sounds interesting to you, please read along.
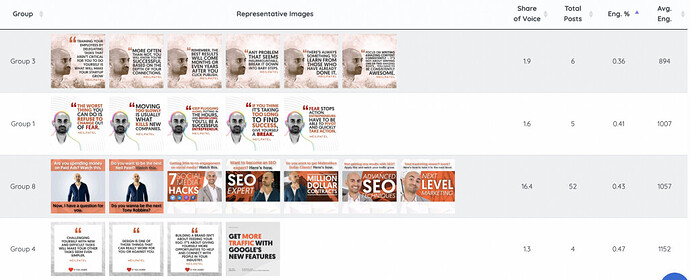
Here’s how the categories for Neil Patel’s handle look like:
-
Neil Patel’s most engaging content is when he posts about his personal life and family. It kind of shows that his Instagram audience really likes to know more about his personal life.
-
His least engaging content is when he posts infographics. Note that they generate only about 10% of the engagement his top performing category gets (4.48% vs 0.36%)
Let me know if this makes sense to you.
Thanks!

