Summer is well underway, but @delagarde and I have been keeping busy, building our own targeting tool for Instagram. With the first few tests and accounts populating our database, I wanted to make use of the data to do an in-depth analysis of Instagram engagement rates (in short: ER).
What you’ll read below are some findings based on a sample audience containing 16,5k accounts, all data has been collected between the 8th and 15th of July 2019.
In this post I will be answering the following questions:
- What’s the overall average engagement rate?
- What’s the average engagement rate per account size?
- What gender receives the best engagement on Instagram?
- What’s the average engagement for businesses on Instagram?
- Do you get more engagement (on average) if you’re using stories & highlights?
Background on the data and tested audience
As mentioned earlier, to do this analysis, I took 16 500 accounts out of our own personal database and worked with their engagement rate and other various metrics we calculate. So for the broad analysis, I’ll be using the full audience size of 16 500 to share the metrics. However, in specific cases (like gender or business category), I’ll be using a subset of the total audience. But if that’s the case, I’ll mention it specifically.
I also mentioned earlier that all the data was collected between the 8th and 15th of July 2019. This is important to know, as engagement on Instagram isn’t set in stone, and can vary widely depending on the season, holiday or other events. There’s even a strong day-to-day change at times. So it’s really a snapshot in time.
To give you some additional insight into the buildup of the audience, I divided them into 9 brackets, according to the size. Here’s how the audience is built up:

Note: for some tests, I’ll be excluding small accounts (those with fewer than 1 000 followers) to test the validity of claims. But these accounts do form an integral part of the Instagram community and have a rightful place within the averages.
Overall engagement rate
Although the overall engagement rate isn’t that valuable, it’s a good measure to determine what the status of the platform is. But this doesn’t take into account the different account sizes inside the audience, so it’s only that valuable.
For July 2019, the overall engagement of the tested audience is 14.17%. This is quite high, but can be ‘explained’ by the fact that the majority (±68%) of the audience tested has rather small accounts (<1000 followers), and those accounts have a rather high engagement by default.
If we leave out the small accounts (and thus 68% of the tested audience), the average engagement rate is 6.68%. Which is a huge difference, but more accurate to compare to for everyone that has more than 1000 followers. But the next section offers an even better insight into the averages.

Average engagement rate per account size
To give more valuable insight into the average engagement rate on Instagram, it’s best to look at account size. In order to do so, I divided all accounts into a specific bracket.
| Bracket 1 | Below 1 000 followers |
|---|---|
| Bracket 2 | Between 1 000 and 5 000 followers |
| Bracket 3 | Between 5 000 and 10 000 followers |
| Bracket 4 | Between 10 000 and 25 000 followers |
| Bracket 5 | Between 25 000 and 50 000 followers |
| Bracket 6 | Between 50 000 and 100 000 followers |
| Bracket 7 | Between 100 000 and 250 000 followers |
| Bracket 8 | Between 250 000 and 1 000 000 followers |
| Bracket 9 | Above 1 000 000 followers |
As mentioned earlier, the engagement rate is highest in the two brackets that hold the accounts with the lowest amounts of followers. They tend to have (generally speaking) a more faithfull and active audience, with whom they often have a personal connection. This ‘effect’ tends to weaken off once an account gets bigger. And that’s what we can see in the chart below.

What gender receives the best engagement on Instagram?
It’s often said that women dominate social media and get the most engagement rate. I’ve even read posts by so-called “guru’s”, claiming you should just create a female profile for your business, just to get more engagement going. Which is just wrong if you ask me, but let’s not go there.
While these claims are likely to be true for certain niches (think fashion, fitness,…) I wanted to test this hypothesis more globally and see if this was true or not.
When we look at the overall engagement based on gender, it seems that male profiles have a small edge over women. But, it’s only a marginal difference of 0.23%.

I also wanted to check if there’s a difference across different account sizes and gender. So going back to the brackets used earlier, I checked for average engagement of male and female profiles.
Here we can see that males tend to receive higher engagement in most cases. Given the account sizes, women are dominating three brackets. For the other 6 male accounts have higher engagement than their counterparts.

Average engagement per business category
Business profiles (and now recently, creator profiles) are widely discussed for their (alleged) effect on engagement. This data set allowed me to test the claims that having a business profile has a negative effect on the engagement rate on Instagram. To test this hypothesis I studied the 8 000 accounts within the dataset that are classified as a business and have a category assigned. So it’s a test on about 50% of the total audience.
Judging on the audience used, it’s safe to say that this doesn’t hold up in reality. In the chart, you can see that the majority of the categories are in between the two lines (for which orange is the overall average of engagement, thus 14.17%, and the green one is the overall average of engagement without the smallest accounts, being 6.69%).
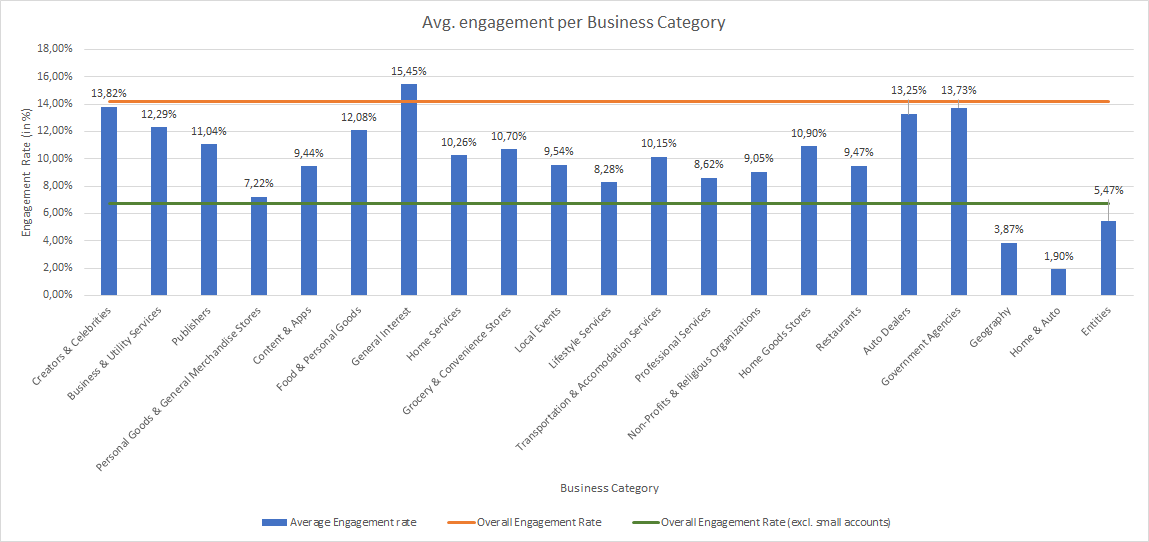
There are only three categories performing below the averages, and that’s “Geography”, “Home & Auto” and “Entities”. But since all three together are only a dozen or so accounts in the dataset, it’s quite possible that this is a very isolated issue. We’ll have to see how a repeated test of this on a much larger scale holds out to give you more a more accurate figure for these three categories.
Please also note that these aren’t all the available categories within Instagram, this is just a snapshot of whatever category was present in the dataset.
With that said, based on this piece of data, we can say that for 85% of the cases, having a business account doesn’t give you lower (than average) engagement. If you are experiencing a lower engagement rate after switching to a business profile, that’s most likely related to how you run the profile, as is being discussed in this medium post.
The effect of Story highlights on engagement
Now let’s get to the final question in this research, stories. Since introduction, stories have been quite popular and Instagram and having a growing amount of users (both creators and viewers). But does the use stories result in a higher engagement on your account? Well, it’s hard to say, mainly because it’s near impossible to track all accounts in my database 24/7 for stories and calculate the engagement rate with the stories data in as well.
So the next best thing I can do is to see if the account uses highlights (which are places where people can catalog, organize and show old stories to their followers). So I split all accounts in my database into two groups: one that uses stories (the blue bar), and those that don’t use stories (the orange bar). And based on this audience, we can see that accounts that don’t use highlights have a (much) higher engagement rate on average.

However, when we disregard the small accounts again (with < 1000 followers), we can see that the data moves the other way :
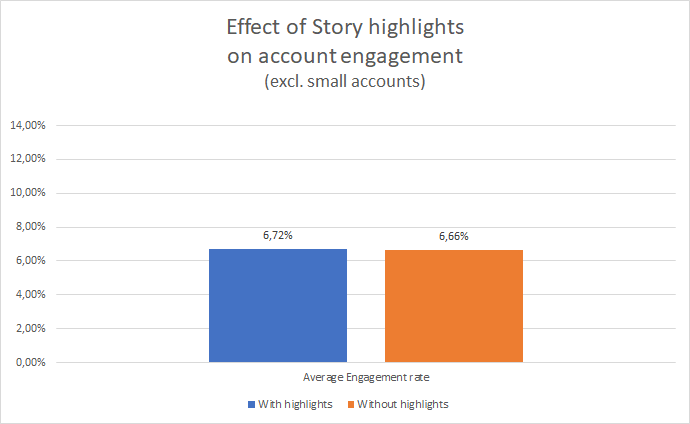
So if we disregard the small accounts, we can see that accounts using highlights (and by extent stories) do in fact have a slightly higher engagement rate than their counterparts (6.72% over 6.66%).
Recap
So just to serve as a quick recap, here are the measures captured within this experiment:
-
What’s the overall average engagement rate?
- 14.17% overall (all accounts)
- 6.69% overall (all accounts, excluding those <1 000 followers)
-
What’s the average engagement rate per account size?
- >= 1 000 000: 2,53%
- >= 250 000: 2,26%
- >= 100 000: 2,74%
- >= 50 000: 2,83%
- >= 20 000: 2,27%
- >= 10 000: 3,14%
- >= 5 000: 4,32%
- >= 1 000: 7,97%
- < 1 000: 17,54%
-
What gender receives the best engagement on Instagram?
- In 6 of the 9 brackets measured, a male profile seems to get the most engagement.
-
What’s the average engagement for businesses on Instagram?
- This is measured per category, but overall it lies between 1.90% and 15.45%.
-
Do you get more engagement (on average) if you’re using stories & highlights?
- When we look at all accounts, you get less engagement when using highlights. However, if we exclude profiles with less than 1000 follower, profiles using highlights tend to get slightly more engagement overall.
Conclusion
For me personally, this was a fun little experiment but I do feel the need to repeat this on a much larger scale. So keep out for a post of mine in the coming months, redoing the same study on a much larger scale.
 You are a Master, such an analysis to share with us
